EEG Imaging Analysis: Visualizing Neural Responses
What it is:
A website to showcase our analysis for the EEG Numbers Study.
What we did:
- Processed and analyzed EEG and behavioral data from 24 participants in a numerical change detection task.
- Developed a data processing pipeline in Python using MNE, Pandas, and NumPy.
- Generated visualizations: butterfly plots, topographic maps of brain activity, LORETA source estimations.
- Established a data processing workflow and output convention for reproducibility.
- Built an internal GitHub Pages website to display our findings.
- View project on GitHub
Internal GitHub Pages website
Read Full Project Details...
The Neurobehavioral Basis of Numerical Processing
This project contains the data and analysis scripts for a study investigating the neurobehavioral basis of the Parallel Individuation (PI) and Approximate Number System (ANS). It analyzes EEG and behavioral data from 24 participants performing a numerical change detection task. The core scientific background is based on a foundational dissertation which details the theories, experimental design, and original findings (see the study by Jean Tang, The Neurobehavioral Basis of the Parallel Individuation (PI) and Approximation Number System (ANS)).
Datasets Overview
The raw data is processed into four primary datasets, each residing in its own directory, to facilitate different types of analysis:
eeg_all/: Includes EEG data from all trials for all 24 subjects, regardless of whether their behavioral response was correct or incorrect. Useful for analyzing error-related brain activity.eeg_acc=1/: A filtered subset containing data only from trials where the participant responded correctly. This is the primary dataset for most analyses.eeg_ds_all/: Includes all trials. “DS” stands for “direction and size”.eeg_ds_acc=1/: Includes only correct trials. “DS” stands for “direction and size”.
Data Processing Pipeline
The analysis is designed as a series of scripts where the output of one serves as the input for the next.
Stage 1: Initial Processing
A foundational Python script takes raw EEG and behavioral data, cleans it, and transforms it into a structured format for MNE-Python. It uses a master file from the HAPPE pipeline to select artifact-free trials and maps electrode locations from a standard 128-channel cap file. This stage outputs segmented EEG data (*-epo.fif) and precisely aligned behavioral metadata (*_metadata.h5).
Stage 2: Visualization and Analysis Subsequent scripts load the processed epoch files to perform detailed analysis:
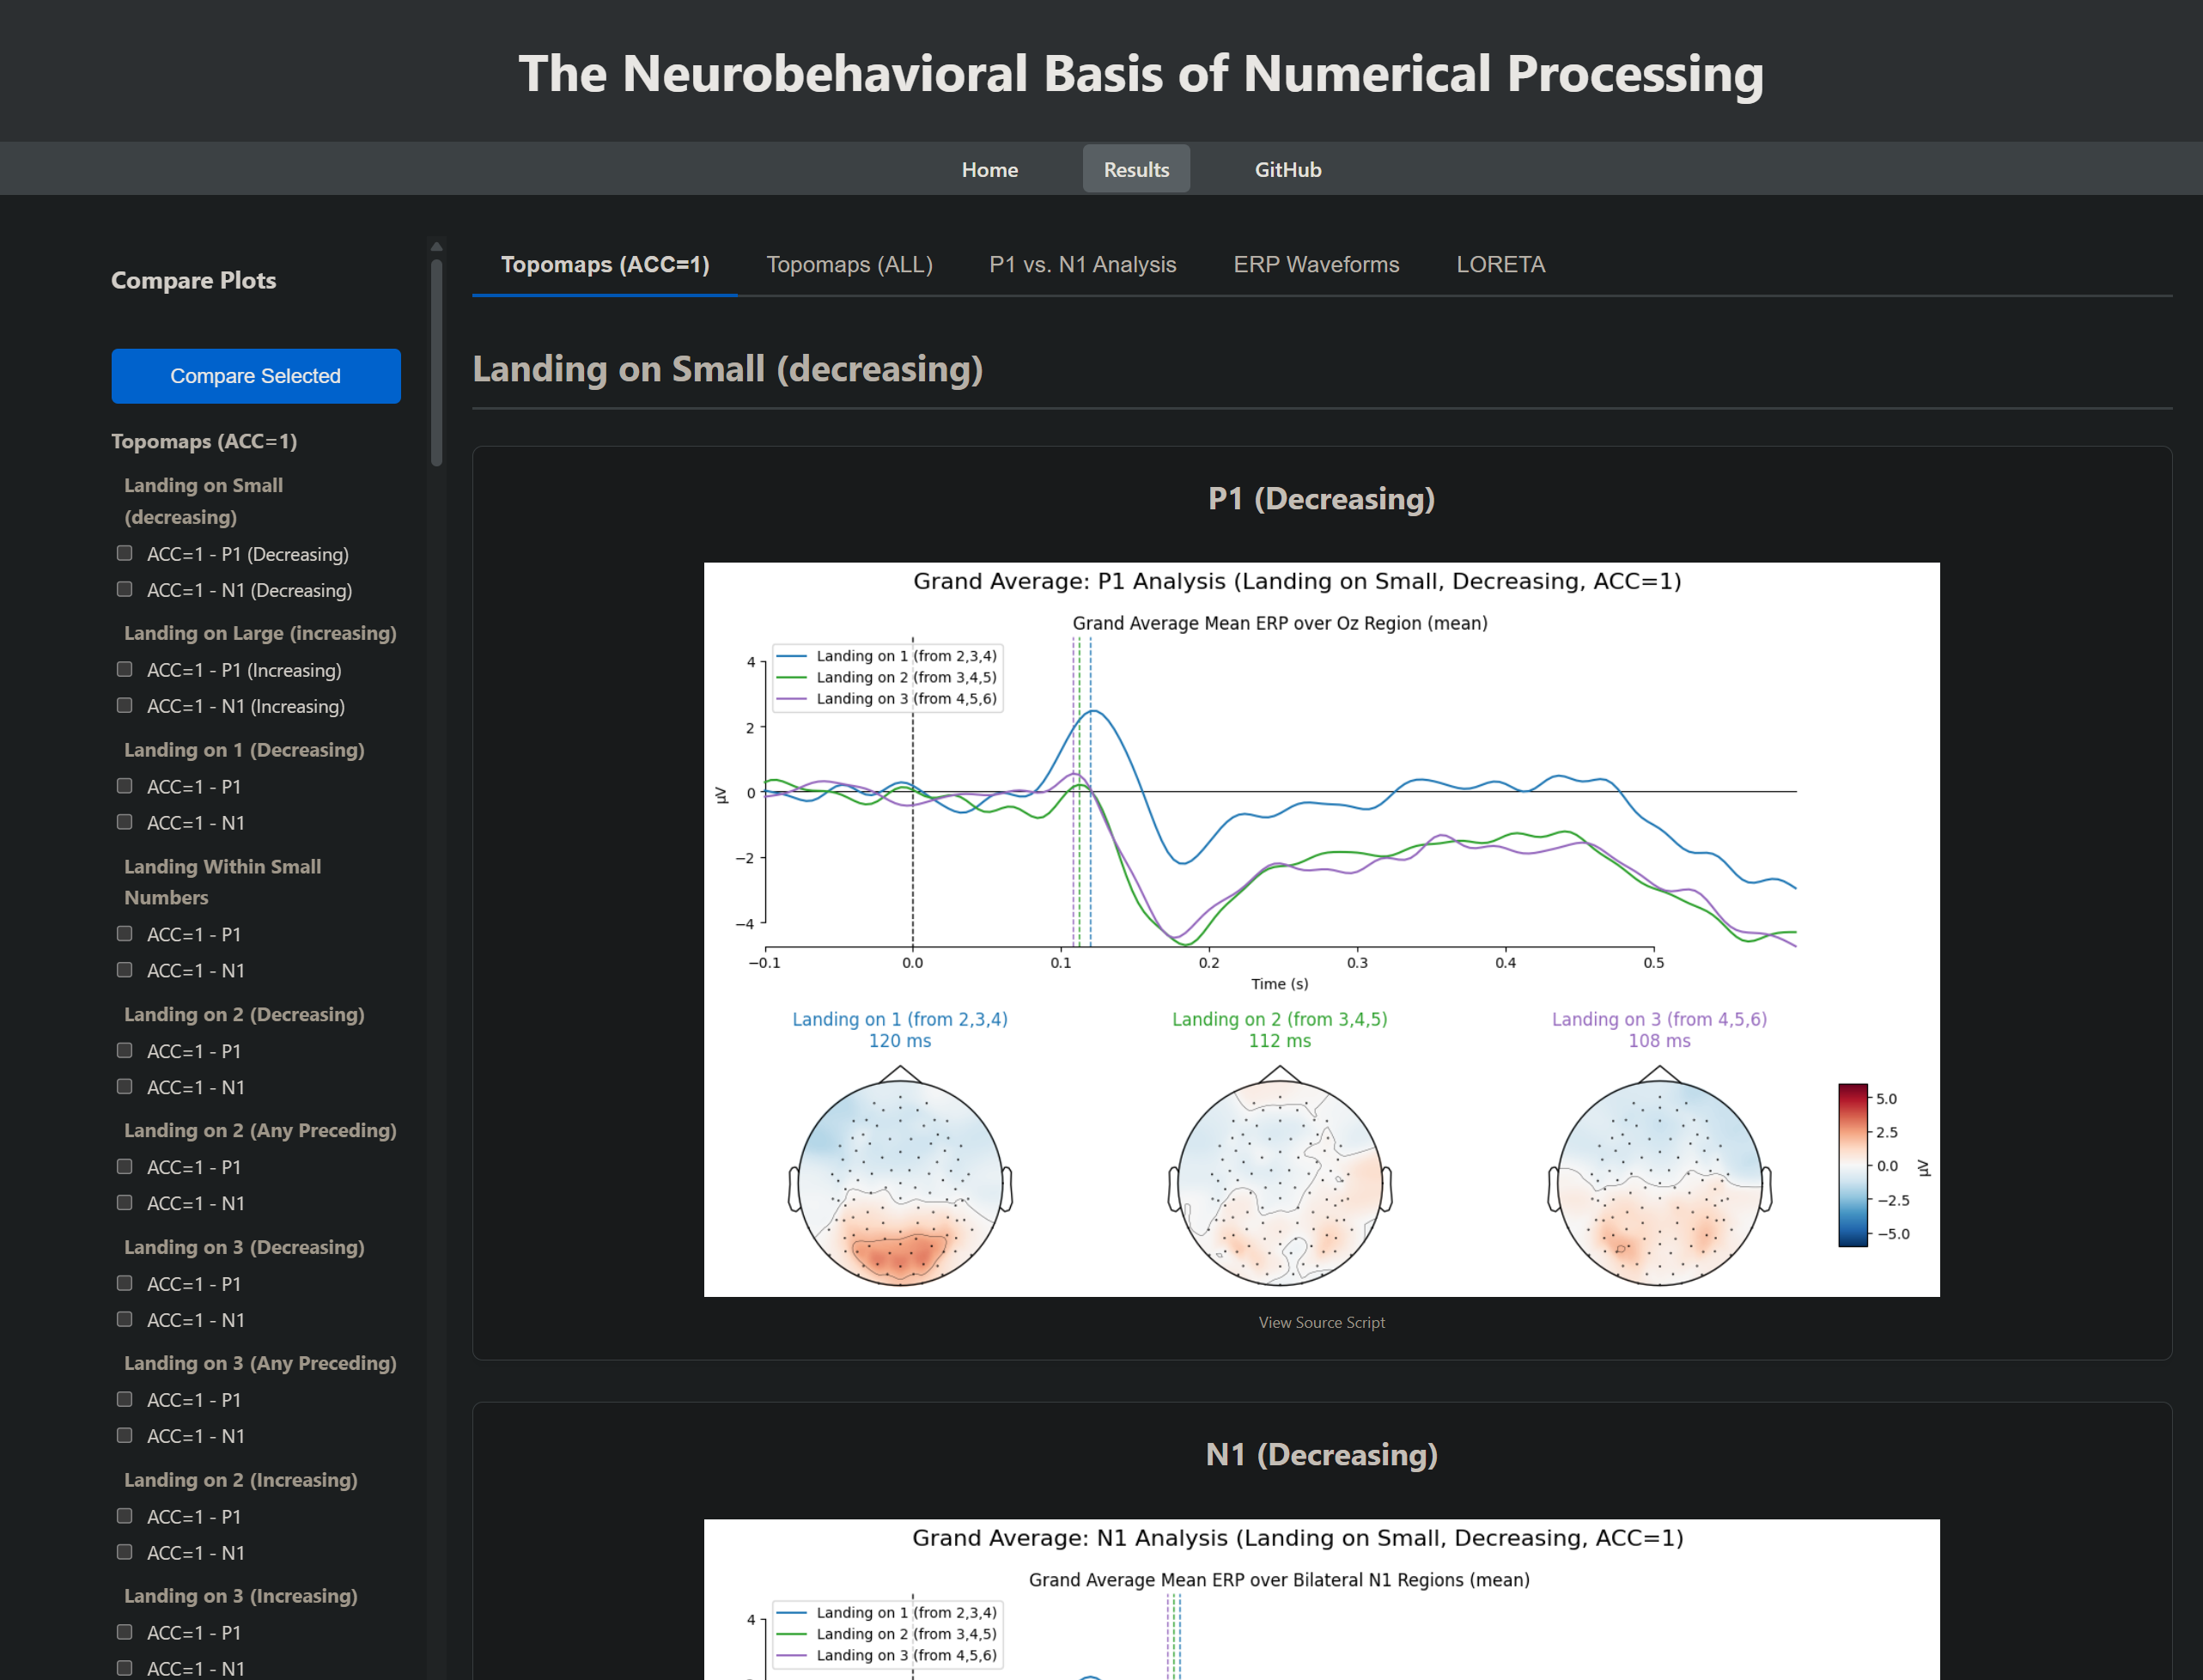
- Generate butterfly plots to view ERP components across all channels.
- Create topographic maps of brain activity at specific time points (e.g., for N1 and P1 components).
- Perform LORETA source localization to estimate the origin of the neural signals, using the
fsaveragemodel from MNE-Python for anatomical reference.
All generated plots are saved to a structured directory system, separating individual subject results from group-level averages for clarity and reproducibility.